

The goal of the project is to create a prototype of a tangible interaction system that will provide compelling and meaningful experiences in a public space on campus using cutting-edge displays and sensor technologies feasible within the next three-to-five years.
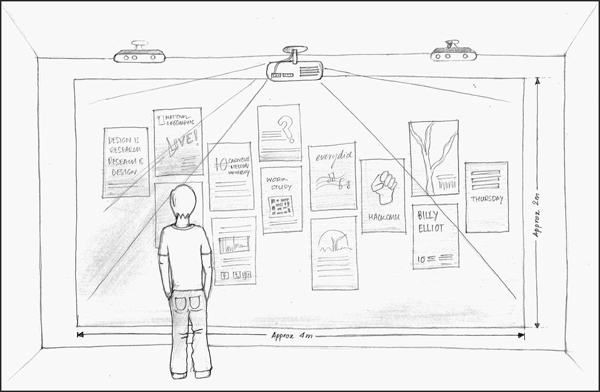
The display, aimed at 4m x 2m, uses a combination of gesture-based sensor technology and smartphones as interaction methods to lower the barrier to entry and encourage the use of familiar devices. The system lifecycle is designed around three ideas to attract the people to use the system, keep them engaged and make sure that the system provides enough incentives for coming back.
System LifeCycle
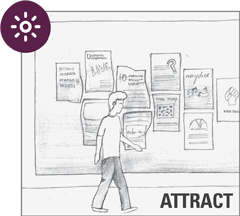
Attract
The size and brightness of the display would attract users and allow for readability from a distance. When idle, the display shows event postings and news related to campus or the surrounding areas. The event “posters” move slightly, as if they were floating in a pool of water. The background colors create an ambience that changes only subtly.
When a user walks by the display will create a bulge effect in the posters or in the background colors, signifying to the user that the display is interactive and is reacting to their movement.
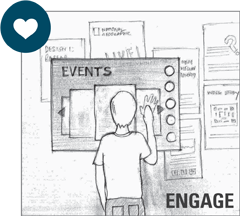
Engage
Once a user has been attracted to the display, a deeper level of interaction can begin. When a user walks up to the large screen, a smaller private screen will appear. A personal interaction pane displays the various services offered, which can be selected using hand gestures and hovering over UI elements.
All the users will be presented with the option to sort and post events, submit photos, review and post classified ads. Saving and posting content can be accomplished through a custom mobile application which interacts with the Campus Portal system. The interaction can also be further personalized within the settings of the mobile application.
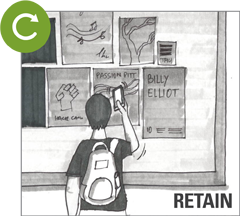
Retain
Not only are there are multiple ways to use this installation, there are also multiple ways to contribute to it. Crowdsourcing the content of this installation is key to user retention and community building. Moreover, features such as the ability to RSVP to an event, to browse a timeline of photos over time, and to check-in provide additional incentive for repeat use.
Trend Analysis
Taking advantage of the rich resources, documentation and case studies available, we explored novel applications of current technology, found inspiration, and drew upon industry trends. The compiled examples cover a wide breadth of technology from large scale 3D projections to finer small scale interactions on personal devices, from practical applications to artistic expression. The collection provides context and a reliable frame of reference for what has been achieved and what is possible.
Each item was tagged and categorized by the following criteria: multi vs. single user, multi vs. single device, indoor vs. outdoor, level of social acceptability, public vs. private, and the level of "stickiness", or how sustainable the system will be for repeated use.
Semi-Structured Interviews

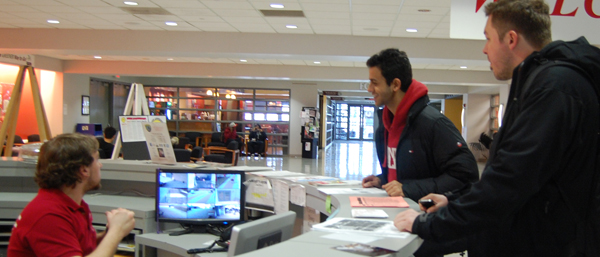
We conducted semi-structured interviews with a number of experts in fields related to interactivity, including an authority on ubiquitous computing technology and hardware, noted interaction designers with extensive experience studying the design process, a PhD student highly recognized for research and development of innovative interactive technology, a local startup specializing in interactive mobile games, and a renowned new media artist. These interviews gave us a deeper understanding of current technology, provided a glimpse into where the future of interactive systems is headed, and informed what key questions must be considered to design an attractive, engaging, and sustainable interactive system.
In addition, two Carnegie Mellon staff members provided valuable insight into students' information needs on campus and a unique perspective on the various stakeholders involved with an on-campus interactive system.
Guerrilla Interviews
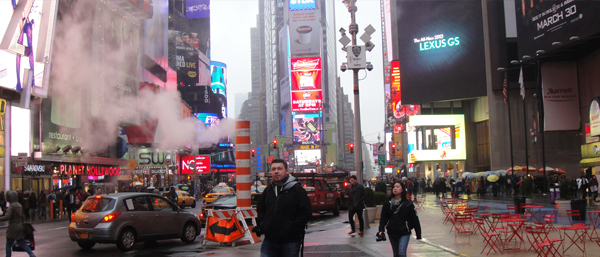
Since our project scope focuses on a university setting, the participants in our user research were active campus users. However, to understand the behavior of users more representative of the general population, we also included various people from other public spaces to identify behaviors that can be translated to a campus environment.
To capture users' needs in context, we performed guerrilla interviews - guerilla-style contextual inquiries with users without any prior arrangements. First, we observed the environment to get to know the relationship between people, the physical layout, and any installations present. We then approached people who demonstrated behaviors specific to an interactive element in the space or those that did not appear to be doing anything in particular. The interview protocol attempted to uncover their motivation for specific behaviors and the engagement factors an installation should have in that space.
Guerrilla interviews were performed on two universities in Pittsburgh, one in New York City, and one in New Jersey. In total, we have interviewed 42 students, staff members, and visitors, among others.
Fly-on-the-wall studies
Public spaces are complex settings consisting of people, physical structures, and services. To understand how interactive installations can be embedded into a space and the social behaviors related to different spaces, we conducted observational studies using the fly-on-the-wall method in 28 places in 4 cities. The places observed included universities, transit stations, museums, plazas, stores, visitor centers, and more.
In each location, we documented two distinct kinds of observations. The first was behavior, which included individual's interaction with other people, technology, and any interactive elements. The second was the environment, including physical layout, traffic flow, purpose of the space and the purpose of any installations in that space.
Although the fly-on-the-wall method may not provide reliable rationale behind people's behavior, the findings derived from our observations gave us valuable design ideas for our eventual prototype.
Artifact Research
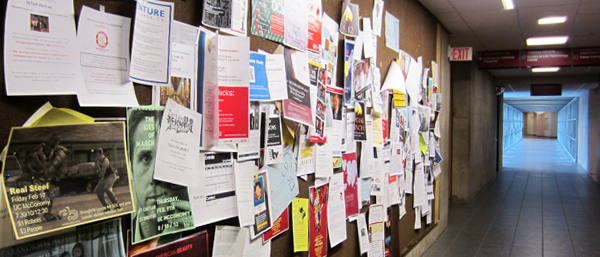
Behavior, needs, and desires can be reflected in the artifacts people interact with. Artifacts analogous to the interactive displays can also reveal breakdowns and design ideas. We conducted a study of bulletin boards across CMU campus to formulate a taxonomy based on location, placement, usage, and content. We also documented artifacts during our field trips by taking photographs of the interactive systems observed in museums, hotels, and transit stations, etc.
Shadowing
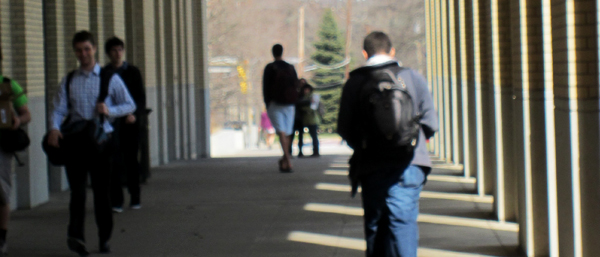
In order to observe their typical, unbiased behavior, we shadowed randomly selected students around campus. The student or group of students were followed for as long as possible without their prior knowledge. We looked for incidences of specific behavior, such as talking to people, direction of attention, or changes in walking speed or behavior.
The goal of this research method is to capture the most realistic and in context user behavior, perhaps actions the subject may not even realize they perform. Since we are most interested in observing routine behavior, shadowing revealed behaviors we may not have learned from guerrilla interviews alone.
We spent a total of seven hours of shadowing nineteen targets on CMU campus.
Affinity Diagramming
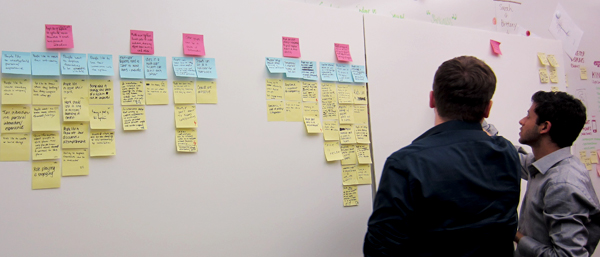
Affinity diagramming is a data interpretation method to reveal underlying themes, patterns and structures across distinct observations and interviews. Affinity diagrams are effective in creating an information hierarchy and uncovering insights at different levels of abstraction. To address our three research areas of user needs, technology and trends, we fashioned separate affinity diagrams associated with different purposes. After finding significant overlaps, insights from individual diagrams were later consolidated and
categorized under common themes.
Data collected from 28 observational studies, 8 expert interviews, 42 guerrilla interviews were synthesized into 5 affinity diagrams. Affinity diagrams were categorized based on the type of location and how the insights related to user needs.